2011 Spring

Turbidimeter, Spring 2011

Emily Clamp, Rohiverth Guarecuco, Julia Morris

Abstract:

The goal of the turbidity team was to create a low-cost turbidimeter that measures water turbidity within the range of 5 NTU to 250 NTU. Thus far, the team has brainstormed various turbidimeter designs and created several prototypes for simultaneously testing different LED display patterns. Many patterns have been assessed, including a dual-range LED display pattern for measuring a broad turbidity range. The dual-range LED pattern was tested using an experimental setup that allowed turbidity measurement of water that was constantly mixed with kaolin clay using a water pump. The team determined that only the fine pattern of the dual-range pattern was necessary, since the pattern alone could accurately measure turbidities from 5-200 NTU. This approach is based on resolution of the fine pattern within the turbidimeter as opposed to the use of contrast when using conventional Secchi disk patterns. The fine-resolution pattern was used to create a low-cost turbidimeter prototype equipped with an NTU scale based on the power-law equation derived from experimental results.

Tubidimeter, Summer 2011

Jennifer Gass, Maxwell Petersen, Heidi Rausch

Abstract:

The goals of this summer’s Turbidity team were to:

  • Finish the testing that the previous team had been working on in order to design a cheap (under $20) Turbidimeter that can easily be transported to potential AguaClara facility locations.

  • Find a relationship between depth and Turbidity that is within 50% accuracy for a specific disk design based on line thickness and spacing.

  • Fabricate and calibrate 10 turbidimeters that will be ready for shipment by July 28, 2011.

Thus far, the team has managed to improve the design of the original Turbidimeter while lowering cost and increasing portability. All ten prototypes were built, calibrated, and sent to Honduras by the specified date. The only shortcoming was that due to size limitations the Turbidimeter could not measure below 15 NTU, however, this does allow for greater ease of use. The final Turbidimeter design is just over 60 cm in height and costs $4.02 to make.

Structures, Spring 2011

Hyeong Yoon, Thomas Shouler, Joe Beaudette

Abstract:

Our main objective we wished to accomplish this semester was to create a means of automating the design of the columns and walls for the design tool. We began this work by analyzing the structural capabilities of the columns and walls for the Alauca plant.

There are three different load cases that guide the design of the columns and walls of the tank. The first case assumed that the tank walls were supported by the surrounding backfill. The second case assumed no support from this backfill. The third case analyzed the structural importance of the rubble which lies at the base of the sedimentation tank.

For our analysis of the walls, we modeled them as closely spaced columns. As seen in Figure 1, the vertical rebar that runs through these walls will add flexural support. By modeling the walls as columns we accounted for this vertical rebar. Modeling the walls as a combination of individual columns also allowed us to use the same tools and procedures that we used for the analysis of the columns. We set the moment at initial cracking as our first failure moment. We determined this moment by using the the Transformed Moment of Inertia method. We also wanted to know the moment that would render the walls and columns could experience before ultimate failure. We believed that this value would be of importance for future analyses which would incorporate earthquake conditions. For this ultimate failure analysis, we used the Column Interaction Diagram. This method plots the area of all axial load and moment cases that a column would be able to support safely. All methods are explained in detail in the report.

Sedimentation Tank Hydraulics, Spring 2011

Yiwen Ng, Anna Lee, Tiffany Tsang

Abstract

Previously our team worked on designing a scaled down model of sedimentation tank in order to study floc blanket formation in 3D models. However, we decided that it would be more effective to continue the study with the existing 2D sedimentation tank. Using this tank our first objective was to determine the minimum angle of repose. We have hypothesized that for an insert angle below 60 degree that a floc blanket would not form. The slope of the insert would not be sufficient for the flocs to be transported to the jet, thus the flocs would accumulate on the incline. However, even when we decreased our angle of repose to 30 degrees, we were successful in forming the floc blanket.

Plate Settler Spacing, Spring 2011

The Effect of Floc Roll-up on Clay-Aluminum Hydroxide Flocs

Matt Hurst, Monroe Weber-Shirk*, Tanya Cabrito, Cosme Somogyi, Michael Adelman, Zachary Romero, Richard Pampuro, Rachel Phillipson, Sarah Long, Colette Kopon, Ying Zhang, Ashleigh Sujin Choi, Adela Kuzmiakova, Jae Lim, Alexander Duncan, Christine Catudal, Elizabeth Tutunjian, Ling Cheung, Kelly Kress, Tiara Marshall, and Leonard W. Lion

Abstract:

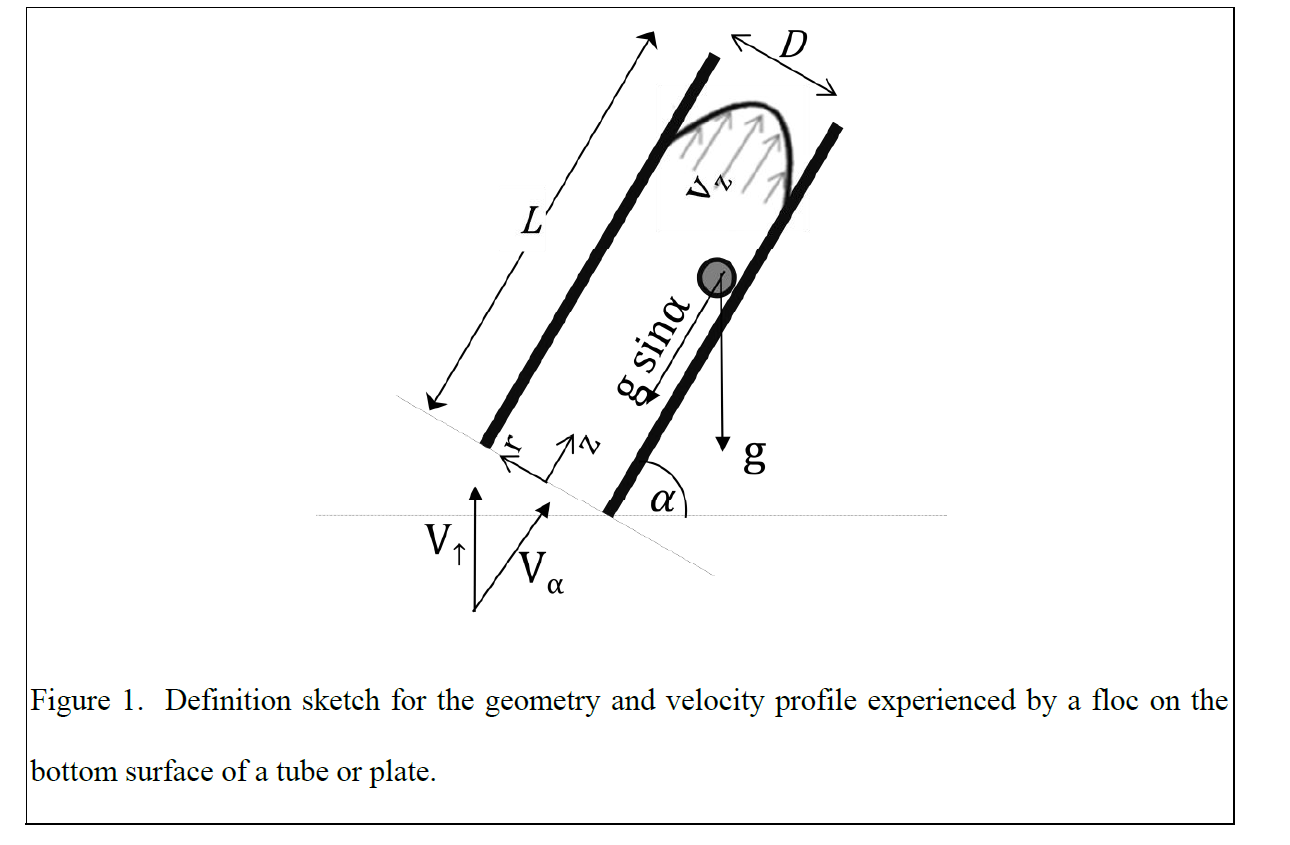
Inclined plate and tube settlers are commonly used to create compact sedimentation tanks. Conventional design guidelines are based on obtaining a desired sedimentation design capture velocity. Theoretically, this capture velocity can still be achieved while greatly reducing conventional plate spacing or tube diameter. The greatest concern with small plate spacing is the danger of settling sludge being swept out with the finished water. This research presents the basis of this failure mechanism as high velocity gradients present at small tube settler diameters and small plate settler spacings.

Chemical Dose Controller, Spring 2011

Matthew Higgins, Adam Salwen, Christopher Guerrero

Abstract:

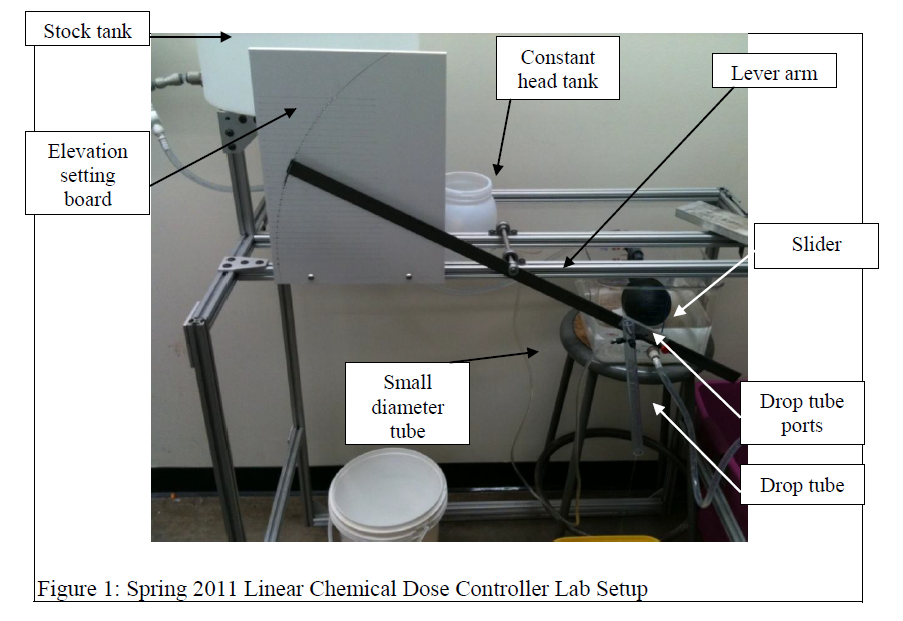
Accurate chemical dosing is important in water treatment plants to ensure optimal conditions for flocculation, sedimentation and disinfection of the treated water. The linear chemical dose controller uses laminar flow through a small diameter tube to create a linear relationship between head loss and chemical flow. The linear flow orifice meter then maintains a linear relationship between plant flow and water elevation. The linear relationships simplify chemical dosing for plant operators who may have a limited education. Our team is researching the upper-flow limit of the linear dose controller and developing innovative designs to increase the capacity of this system to function in plants with flow rates approaching and above 100 L/s. Furthermore, we are redesigning and simplifying the linear flow orifice meter algorithm to improve its precision and performance in the field.

Fabrication, 2011 Spring

Primary Author: Daniel Cohen

Secondary Author: Travis Hartway

Abstract:

The fabrication team developed fabrication methods and designs to be used at AguaClara construction sites that are feasible and economical. We worked to improve hole cutting/drilling methods, designed entrance tank components such as trash racks and an adjustable overflow weir, investigated methods to attach pipes to the inlet manifold, and sought a longer lasting on-site power source. We developed a much better understanding of the AguaClara project and made several valuable contributions to implement in future construction sites.

2011 fab1.PNG

Chemical Dose Controller, Spring 2011

Matthew Higgin, Adam Salwen, and Christopher Guerrero

Abstract:

Accurate chemical dosing is important in water treatment plants to ensure optimal conditions for flocculation, sedimentation and disinfection of the treated water. The linear chemical dose controller uses laminar flow through a small diameter tube to create a linear relationship between head loss and chemical flow. The linear flow orifice meter then maintains a linear relationship between plant flow and water elevation. The linear relationships simplify chemical dosing for plant operators who may have a limited education. Our team is researching the upper-flow limit of the linear dose controller and developing innovative designs to increase the capacity of this system to function in plants with flow rates approaching and above 100 L/s. Furthermore, we are redesigning and simplifying the linear flow orifice meter algorithm to improve its precision and performance in the field.

2011 CDC.PNG